Approving Binokula Instant for your organisation
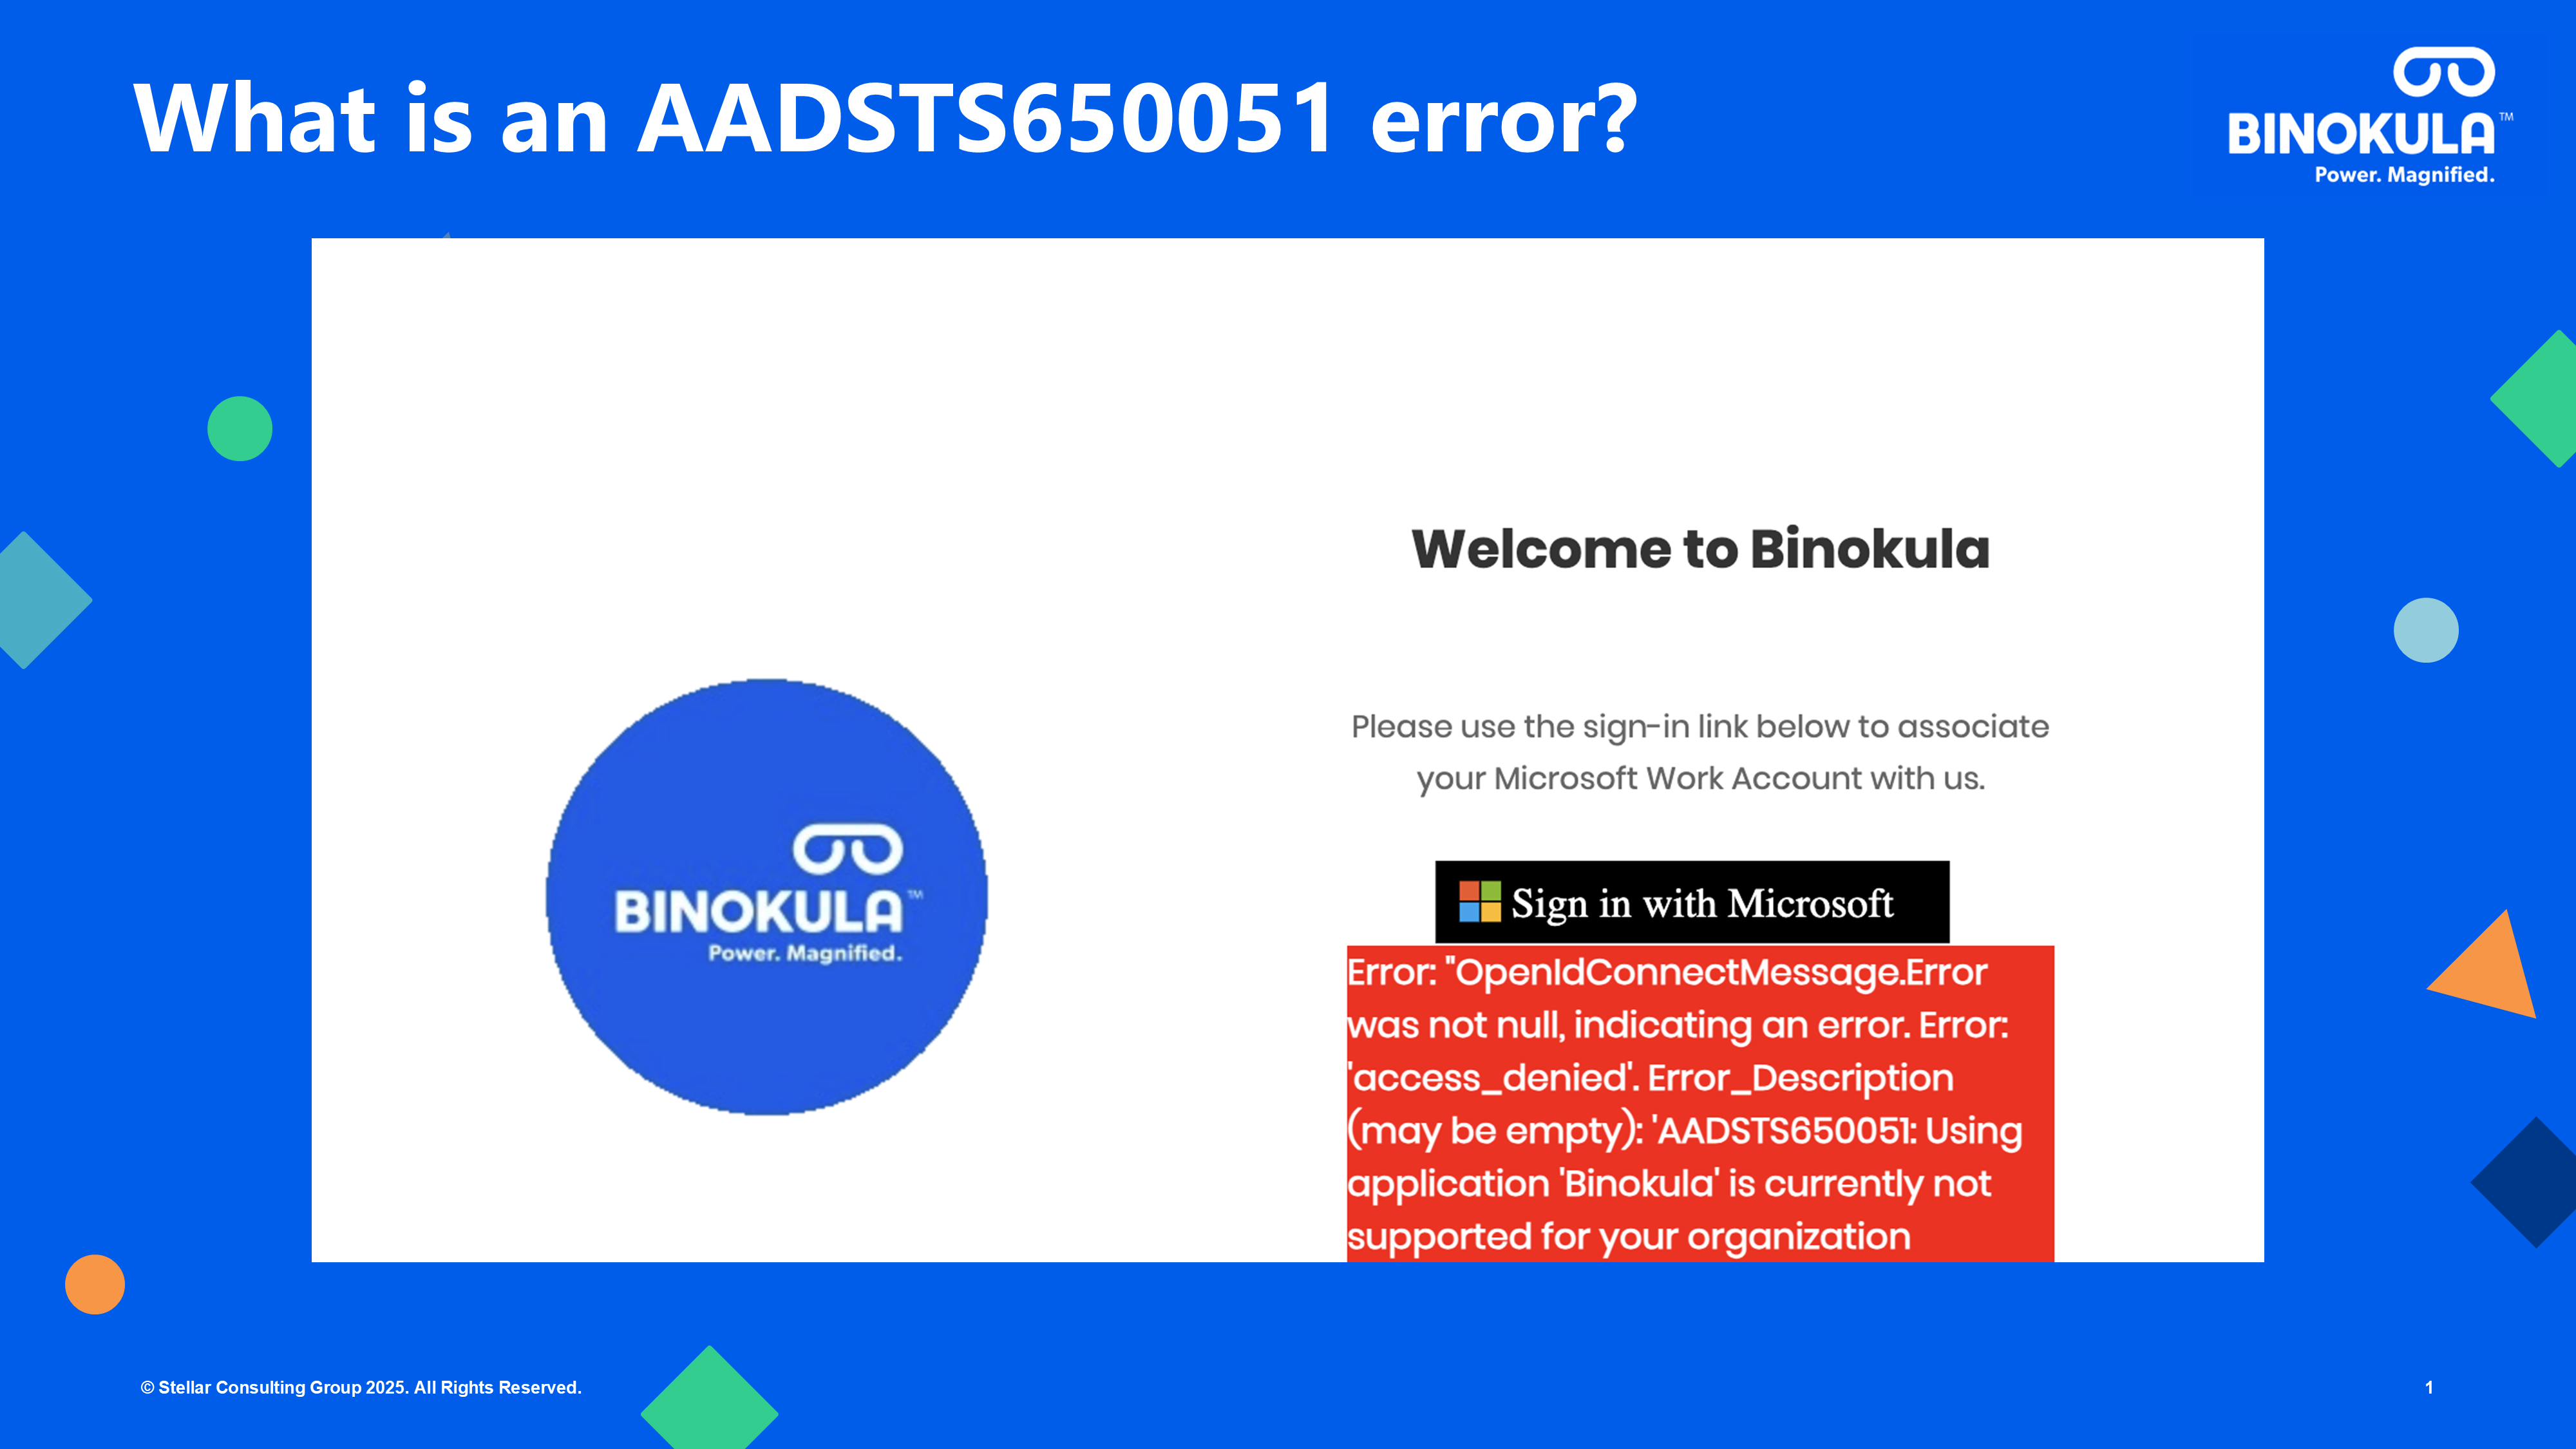
Setting up Binokula Instant and you see this…?! You’ve reached an error on the portal screen: AADSTS650051. So, you’ve deployed Binokula Instant and followed the first-steps guide and have encountered the error above. 🙁 Not to worry, we know what has happened and why: The user error AADSTS65001 is because “The user or administrator has […]
Managing data sources and report refreshing with your Binokula Instant tenant.

Managing data sources and report refreshing with your Binokula Instant tenant This article explains how to configure your secure connections to Power BI data sources and set up refresh rates for reports so you can ensure external business contacts receive critical up-to-date information and timely insights for new action. Stellar Consulting launched Binokula Instant to […]
Get your business “Power BI workspace-ready” for external sharing.

Setting up Binokula Instant is straightforward; however, we recognise that you may need a bit of help on the Power BI side to optimise and accelerate your report sharing ability. We introduce to you our Binokula Instant Configuration Service
New features for Binokula (November 2023)
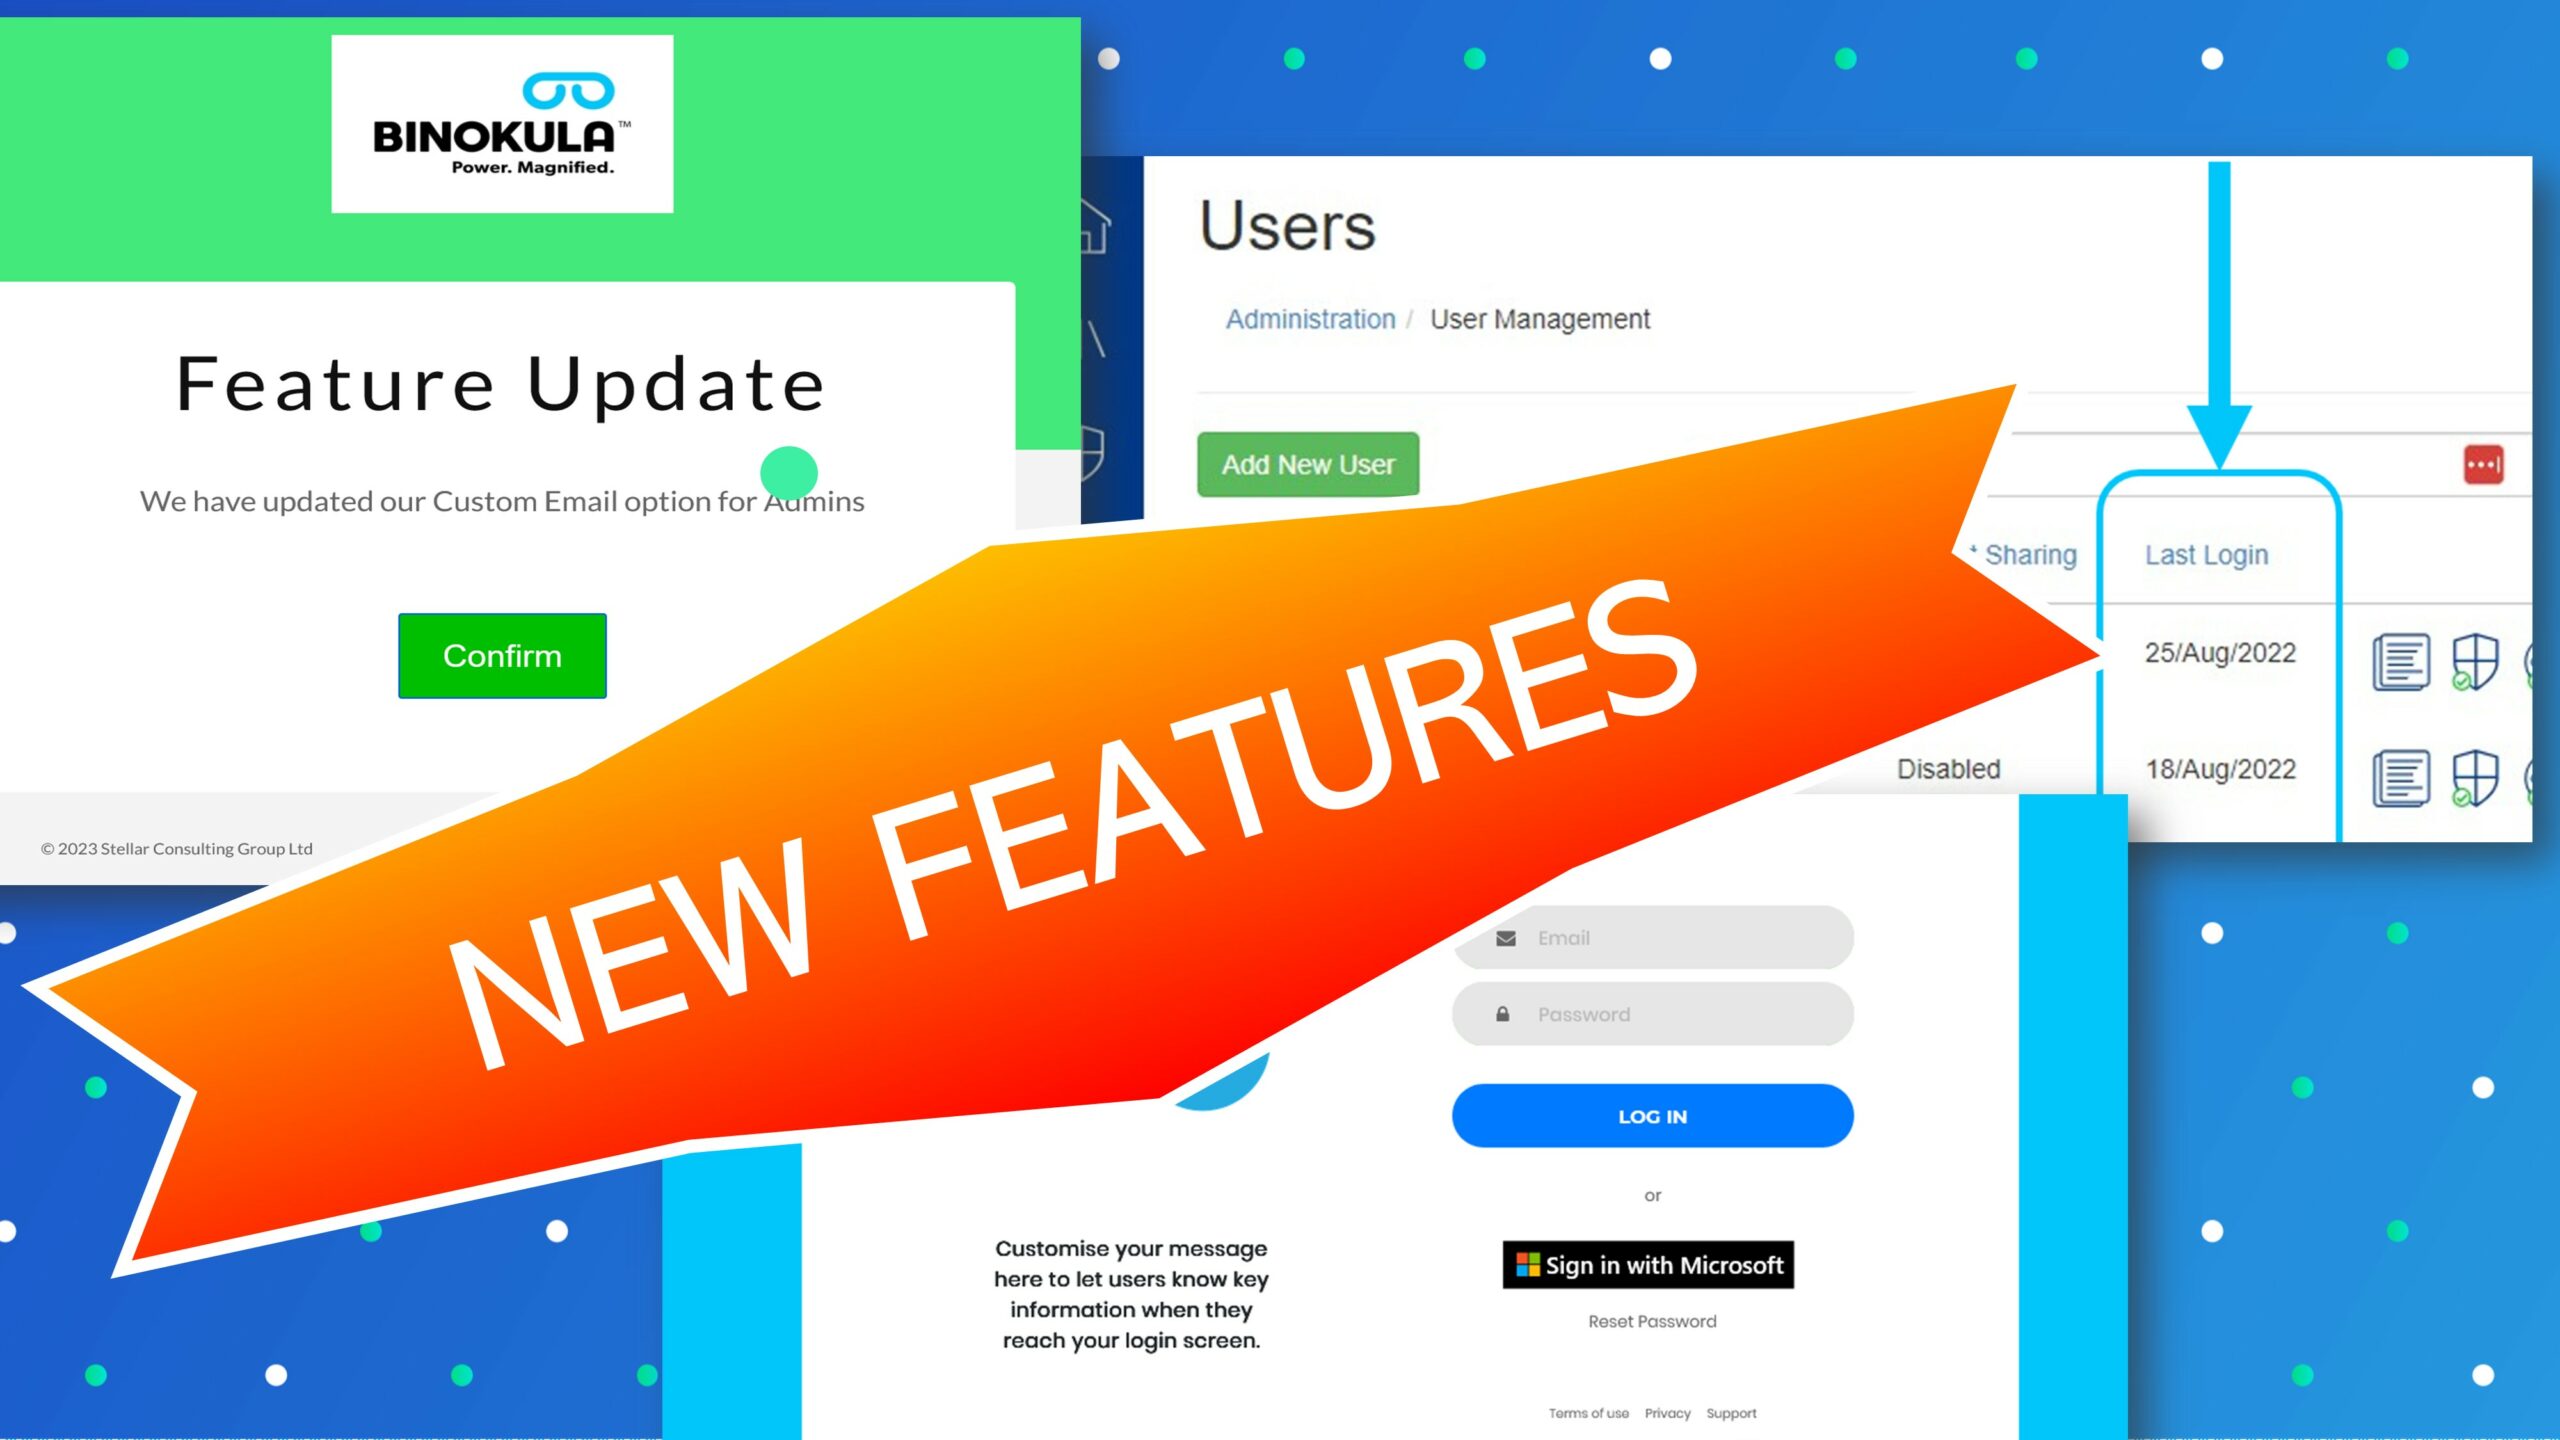
New features released for Binokula (November 2023) The team has three new features NOW LIVE for both our standard Enterprise plan and our Instant offer available directly via subscription from the Microsoft Marketplace. See below for an outline of each of the following: Custom Email Invitations Login Screen Message Last Visit status See below for more detail… Custom […]
Top 3 Power BI report sharing challenges identified by ChatGPT

Top 3 Power BI report sharing challenges identified by ChatGPT Artificial intelligence is seen as potential breakthrough in finding solutions to our business challenges, but how well does it know the issues we face? We decided to get very direct and ask ChatGPT about how well it knows the challenges relating to sharing Power BI […]
Reporting carbon emissions from Azure Cloud

Reporting carbon emissions from Azure Cloud Addressing climate change requires action across the global community. The Paris Agreement in 2015 is a binding commitment on 192 countries to cut global greenhouse gas emissions to limit the global temperature rise this century to a preferred 1.5 degrees Celsius. From a CO2 emissions perspective, this requires that […]
Importer Analytics Shared with Distributors

Importer analytics shared with distributors A mindset for data-led insights Maria Green is an executive from World Wide Importers. Her company began a few years ago as an importer of toys for the USA, directly servicing retailers around the country. Early business returns were built on steady organic growth via a small team of salespeople. […]
Three new development releases for all Binokula Administrators

Three new development releases for all Binokula Administrators Hello, friends of Binokula, Our team continually seek improvement of the Binokula application and experience. In recent months we have launched the Export to File and Snapshot to PDF functions to help Users take insights further, along with a refresh of the iconography for a simpler view […]
Improved integration of Binokula with your existing applications

Improved integration of Binokula with your existing applications The Binokula API enables you to integrate your interactive reports into your existing applications. It provides some great opportunities, and these are outlined in this previous post. A new feature in the Binokula API now enables you to better manage changes between reports and your applications. Previously, when […]
Create a seamless ‘interactive report’ experience for your users with Binokula

Create a seamless ‘interactive report’ experience for your users with Binokula Add Power BI ‘interactive reports’ to your existing applications and delight your users. Binokula includes an API (application programming interface) that enables your applications to interact with Binokula. This enables a user to click on a button in your application and have either: their […]
What is a Power BI Embedded Node and why do I need one?
What is a Power BI Embedded Node and why do I need one? Power BI from Microsoft – part of the Power Platform suite – allows organisations to create rich interactive reports that empower users to gain deep insights into their organisation operations. Many organisations are familiar with the Power BI Pro (or Premium) desktop […]
Exceptional Toyota customer experience with Binokula
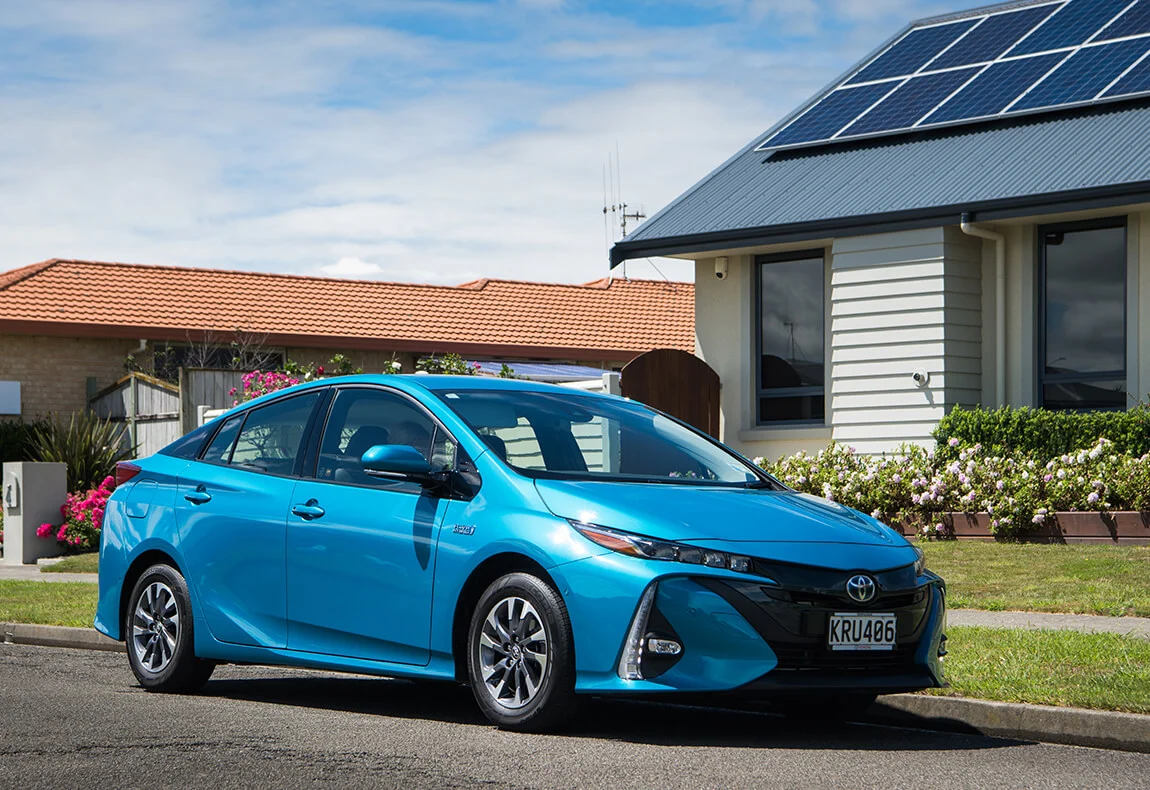
Exceptional Toyota customer experience with Binokula Toyota NZ is a subsidiary of Toyota Motor Corporation, Japan and sells new Toyota and Lexus vehicles as well as used vehicles, parts and service. Key operation locations are at the National Customer Centre in Palmerston North, Vehicle Operations in Thames and a Port of Entry facility and Corporate […]
