Maria Green is an executive from World Wide Importers. Her company began a few years ago as an importer of toys for the USA, directly servicing retailers around the country. Early business returns were built on steady organic growth via a small team of salespeople.
She has always been detail-oriented, placing a high value on data and trends. Her approach with her sales team is striving to measure what is most important and keep them informed of key updates. Savvy in business intelligence, Maria recognised the benefits of using Microsoft’s Power BI – the world’s most popular business analytics service – to communicate sales and inventory dashboards to her team.
The World Wide Importer team quickly developed their strength in sourcing. Competitive advantage was established with access to quality international manufacturers, commercial licensing practices, and a well-coordinated logistics process to ensure on-time arrival and availability for customers.
Maria’s key challenge was to capitalise on this sourcing capability with by finding sales growth. She wanted more ranging success with retailers and store coverage across wider geographies. Retail sales of toys in the USA is a very competitive market; subject to short-term trends and with the seasonal nature of certain items. Investing extra resources in a direct sales strategy would likely distract her from continued efforts to retain a leading advantage in sourcing capability.
As a result, her sales strategy priority became partnering with two leading toy distributors; Tailspin and Wingtip. Maria managed these partner relationships directly. She had already been utilising her Power BI analytics, reporting and visualisations to effectively communicate business intelligence for her team, but struck a challenge when sharing with partners…
She had confidential data that she didn’t want to share via email without some extra form of security. She didn’t want her team to spend invaluable time on manual report creation, isolating data to what only each distributor should see and sharing in spreadsheets and PDFs. Additionally, she wanted information that was available and updated every day (particularly with those short-term seasonal sales promotions!) rather than an exported file with a lagging view of results at the end of a month.
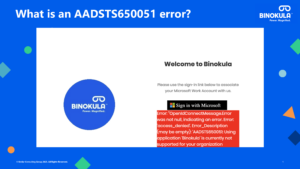
She wanted her partners to gain access to Power BI. Power BI report sharing requires both the individual purchase of Power BI licenses and managing user access via Azure Directory. Fine within your organisation, but Maria recognised the burden of reviewing and approving all user requirements for granting access to external organisations. Her agreement with an outsourced IT provider meant additional costs in managing the implementation and changes on her behalf. What to do?
Binokula is a solution that grew out of addressing a business challenge such as this – how to provide the business insights from Power BI to your wider ecosystem of partners and stakeholders. The Binokula application (software-as-a-service) utilises your Power BI workspace and embedded node to allow sharing to any external user – without the need for a Power BI license. As a Binokula user, you gain access to assigned Power BI reports and all you need is an email address, internet and a web browser.
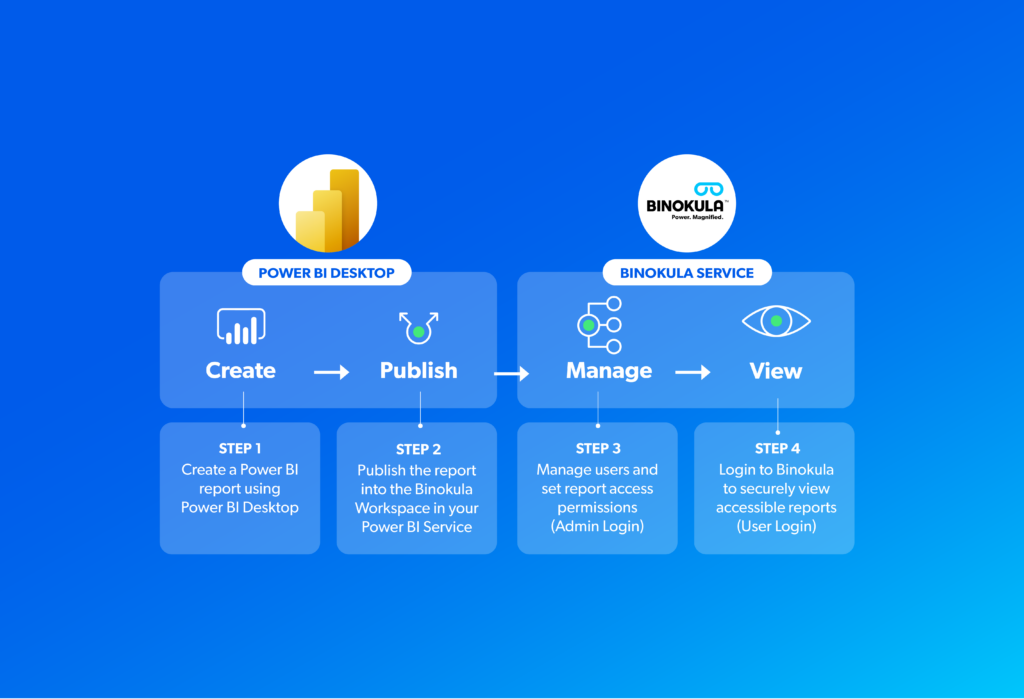
As the Binokula administrator, you control who is assigned access to specific reports and provide access. Maria, having been onboarded with Binokula as her sharing solution, was able to view reports published in her company’s Power BI workspace is available for access in Binokula.
It was important to her that no confidential data was stored in Binokula. The Binokula application provided users with a “window to the world” that, once logged in, clicking on a report would render in the browser as though they were looking at a Power BI application.
Maria herself was able to assign other Administrators to set up users, along with their report access, to ensure those who log in only get access to what they see. For example, Maria has set up an Executive user group with access to a suite of reports providing sales, inventory and purchasing insight for World Wide Importers, allowing the review and drill-down to regions, distributors and other buying groups.
By comparison, Sam from Tailspin is a user only but has anytime access to a dashboard with sales and category trends over time. Maria has also enabled a setting as a Binokula admin to allow Sam to share links to and down PDF and Excel versions of their tailored distributor report. Now, a regular topic of discussion within the Tailspin team on finding improvements, these form the basis of evidence-based review discussion with Maria and the World Wide Importer team to continually find improvement and maximise the potential for further sales growth across the entire country.
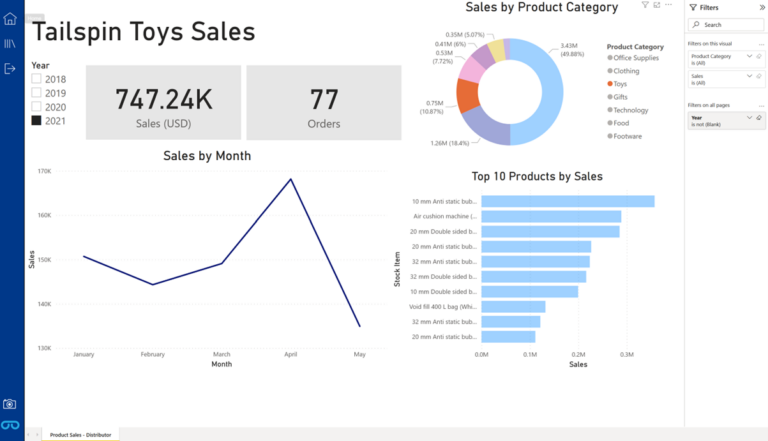
Figure: Example Distributor sales dashboard in Binokula.
Maria’s story is fictional, created for the purposes of building our demonstration site. Nevertheless, this situation is very much illustrative of the challenges Binokula subscribers encounter: progressing on a data and analytics journey and being able to include external partners as part of regular reporting workflows.
Try our live interactive report – available 24/7.
See that it is just like using Power BI. See the differences in report access between World Wide Importers and their distributors.
Binokula was created by Stellar Consulting Group, an award-winning Microsoft Gold Data Analytics Partner. We are here to help businesses succeed by empowering their affiliate networks with greater knowledge and insight.
As big fans of Power BI, our initial version of Binokula was “Binokula for Power BI” to add important functionality that allows companies to securely share Power BI reports beyond their firewalls with ease. The future for Binokula is to allow the publishing of reports created by other popular reporting toolsets.
© 2025 Stellar Consulting Group Ltd
Subscribe to our newsletter