In today’s world, many small and medium businesses have to face the reality of competing with online retailers and large corporations that can offer competitive prices due to efficiency and reduced operating costs.
For those small and mid-markets to compete with corporates such as Amazon, Alibaba, eBay, Walmart, and so on, they must utilise their data to create competitive advantage and better position themselves in the market through a point of difference.
Essentially, competitive advantage relates to factors that allow a company to provide products or services better or cheaper than its rivals, where cheaper is not just about lower price, but with lower cost and a higher margin.
Using data helps those companies to make have a better view of their business, helps them to make better decisions, provides a clear overview of their operational and financial situation, helps to identify sources of waste, and points of operational inefficiency, and can help to simulate scenarios to be used when defining business strategies.
Becoming a data-driven business is no longer an option, it is a matter of surviving, evolving, and staying ahead of the competition.
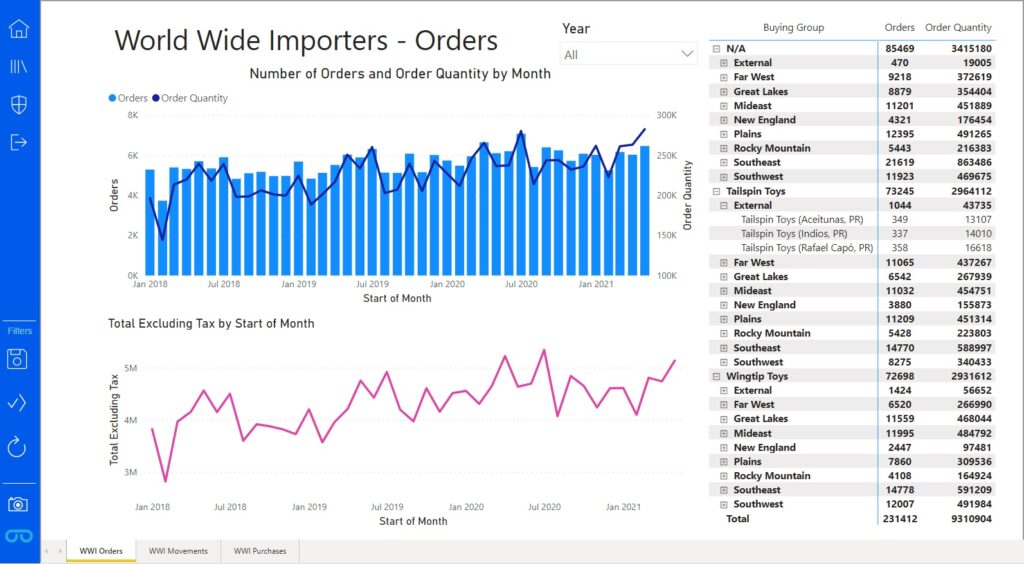
By analysing data, managers can quickly identify which customers are buying, which products are being sold, and which ones are in decline. Managers can quickly visualize customer spending trends by monitoring their purchases on a daily, weekly, monthly, or annual basis, and can understand which products have to be offered at a special price to reduce inventory.
Identifying these trends highlights new sales opportunities. An important opportunity lies with cross-selling complementary products. For example, a store may sell washers and dryers. A customer may need to replace only their dryer, but by bundling them together at a very attractive price point, companies are offering an incentive to purchase the pair. If a wholesaler and retailer finds that they are only selling dryers to a customer, it may be that the customer is getting a better deal on washers from another supplier.
With this information, sales representatives can have a meeting with customers to determine the true needs and quickly provide a solution or a product bundle.
Now imagine those businesses that offer field services and their personnel work externally or depend on sub-contractors. Busy schedules, hourly-based revenue, moving from one customer to another, from one site to another, every minute counts. By analysing data managers can identify which technician is more productive in a particular service or procedure, what are the gaps in training and capabilities, which services are more profitable or costly, and which schedule arrangements are more efficient from a logistics perspective.
Managers and planners can use data to rearrange their personnel, service types, work orders, and schedules to make better use of time, skills and capabilities, and optimise their revenues.
All of this can be accomplished with the use of Business Intelligence (BI) and Analytics.
The next step to creating competitive advantage after becoming a data-driven business is to engage your business network and external partners. When you already use data and analytics internally to understand your business and make decisions, you can start creating a broader culture of using data to eliminate waste, improve efficiency and leverage growth.
By engaging your sales and field service people, sub-contractors and suppliers you can create awareness related to business and market aspects among your network, which will result in additional collaboration and support towards your business strategy and goals.

Binokula is a web application (web portal) that can be used to empower users worldwide with knowledge and insights. With Binokula, you can share analytics dashboards built with Power BI with external users, even when those users are not Power BI users or don’t have Power BI skills. The process of sharing reports and dashboards using Binokula is easy and simple, just taking a few clicks to invite users and define their view permissions.
Ready to start sharing Power BI reports externally with safety, security and at scale? Start our free trial today.
Author: Andre Nunes
Binokula was created by Stellar Consulting Group, an award-winning Microsoft Gold Data Analytics Partner. We are here to help businesses succeed by empowering their affiliate networks with greater knowledge and insight.
As big fans of Power BI, our initial version of Binokula was “Binokula for Power BI” to add important functionality that allows companies to securely share Power BI reports beyond their firewalls with ease. The future for Binokula is to allow the publishing of reports created by other popular reporting toolsets.
© 2025 Stellar Consulting Group Ltd
Subscribe to our newsletter